
Click Here and watch Campaign Reports video tutorial
You will see your reports listed in a report window like this:
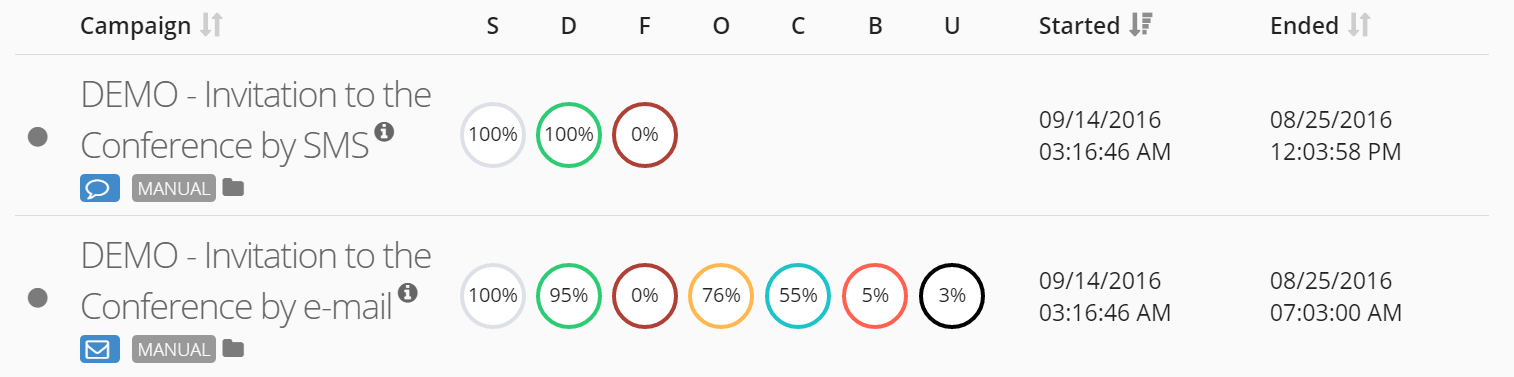
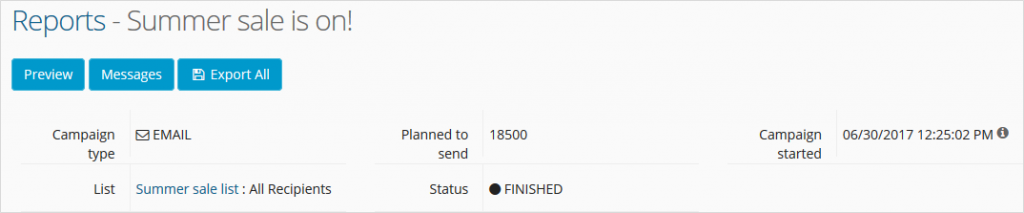
Campaign reports show general information about finished campaigns.
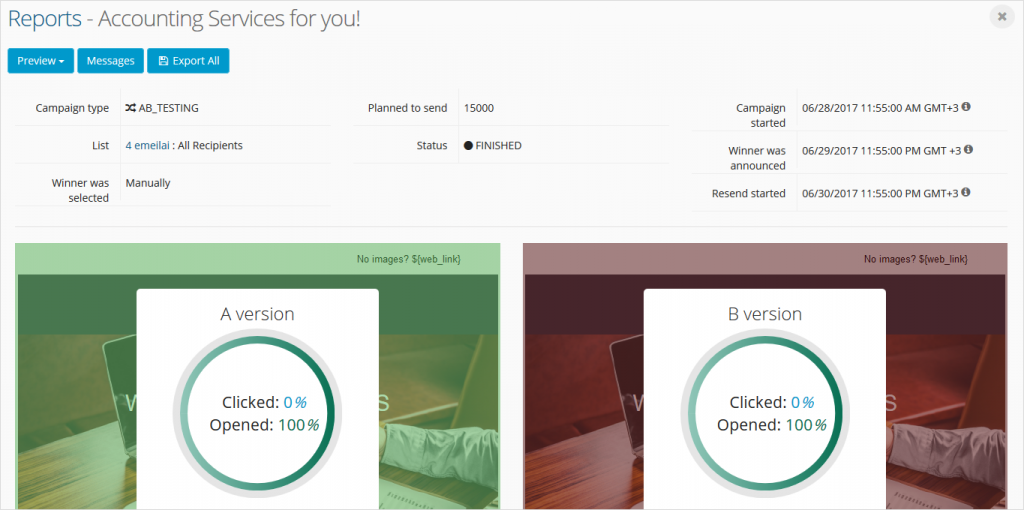
A/B test campaign reports look slightly different because they give you some additional information, including the results for both campaign versions.
A report includes:
- Channel used for sending campaign;
- Name of the subscriber list used;
- Number of planned to send messages;
- Campaign status;
- Start and Finish dates of the campaign.
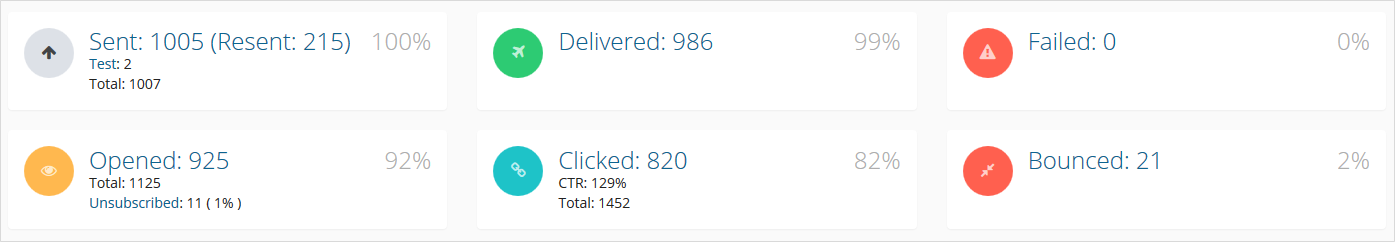
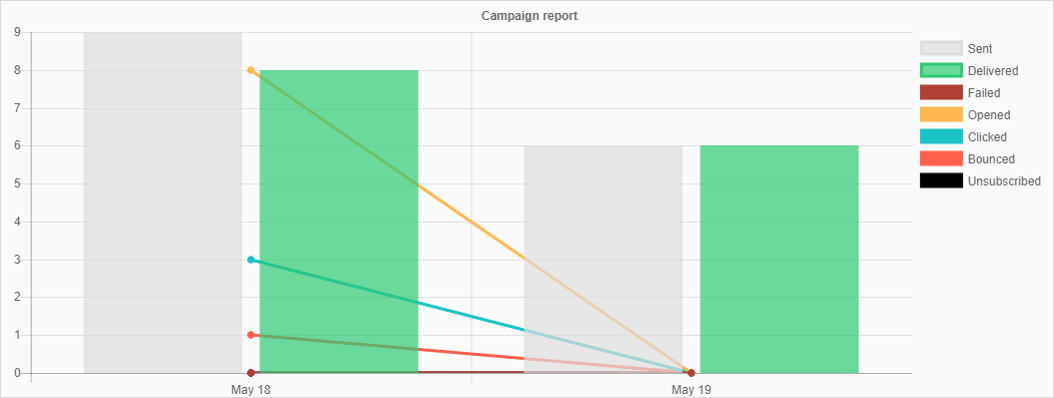
Information about the campaign messages is conveniently displayed: Sent, Delivered, Failed, Opened, Clicked, Bounced, Unsubscribed, and the Click-Through Rate (CTR). Reports also show unique clicks and total clicks on your messages, as well as percentage of sent messages. Most of this data is also represented graphically for your convenience.
You can view detailed report of every subscriber who participated in this campaign by clicking on “Messages” button in the top left and then selecting a subscriber you are interested in. Note that you can also view even more detailed results and performance of each and every subscriber by using advanced search.
There are also other useful campaign report features available:
- You can check a campaign message preview by clicking on “Preview” button.
- If you click on “Messages” button, you will be able to see to what addresses the messages were sent to.
- You can save a report on your computer by pressing “Export All”; a CSV file containing campaign information will be generated and downloaded to your computer.
- Report also includes some graphs that show a visualization of the fluctuation of messages sent over a certain period of time.
- Percentage of Unsubscribed users is counted from the number of Delivered messages.